In these four blogs, we are going to talk about the main features of a network management and monitoring tools and, as far as possible, compare some popular software in this area. In these four blogs, we are going to talk about the main features of a network management and monitoring software and, as far as possible, compare some popular software in this area.
List of other blogs in this blog collection about network monitoring tools:
Network Monitoring and Performance Management (NPM) Tools – Part 1
Network Monitoring and Performance Management (NPM) Tools – Part 3
Network Monitoring and Performance Management (NPM) Tools – Part 4
Performance Issue Diagnostics and Root Cause Analysis
The company needs to know what the issue is and what’s causing it in order to properly deal with it. Root-cause analysis (RCA) has its roots in incident management. In fact, the “root-cause” is the event that, when corrected, will clear other events which happen to be effects, rather than the actual cause of the event storm.
Today, vendors are introducing data analytics and root cause analysis to help enterprises identify what’s happening on their network. A powerful network monitoring software should be able to detect RCA and suggest a solution.
SolarWinds Orion (NPM)
SolarWinds Orion platform documents network data for effective network performance troubleshooting and root cause analysis. This software allows you to diagnose root causes and accelerate time to resolution. In fact, Network Configuration Manager provides detailed visualizations of historical and real-time configurations.
Also, SolarWinds Orion has a tool that is named Network configuration management and it allows you to monitor rapid change across complex and multi-vendor networks.
With SolarWinds NPM and Network Configuration Manager, you can visually correlate performance data to identify root cause and reduce the impact to your end users. Also, historical network data lets you analyze the effectiveness of pre- and post-policy traffic levels.
Datadog
Datadog’s unified monitoring platform allows you to seamlessly pivot between frontend and backend metrics, traces, logs, and more all in one pane of glass, so you can identify root causes faster.
The network diagnostic tool PRTG quickly puts you on the right path and ensures network performance.
There are 3 steps for performing a network diagnosis:
- Narrow the search for errors
- Use a specialized diagnostic tool
- Eliminate the errors
PRTG
PRTG offers monitoring sensors for web servers, mail servers, database servers, and more. Event log sensors monitor the number of new entries per second. You can filter by log files, event types, sources, messages, etc. You can also have PRTG read and monitor the logs of target systems such as your CDN.
And finally, PRTG gives you access to a variety of pre-configured Windows sensors. These sensors rely on WMI (Windows Management Instrumentation) and performance counters.
ManageEngine OPmanager
With ManageEngine OPmanager you can diagnose and resolve problems before the end-user knows about it. Get notified of problems through e-mail and SMS alerts. Automate problem-resolution by executing corrective programs/scripts, sending SNMP traps. Also you can trigger actions such as automatic start/stop/restart of Windows services, VMs and Amazon EC2 instances based on threshold violations.
In ManageEngine OPmanager, the Root Cause Analysis view is displayed in a hierarchical structure. This Root Cause Analysis view can be accessed in all the pages of the web client. For example, Root Cause Analysis for WebLogic Monitoring is done on a number of attributes such as servlet execution time, execute thread current idle count, active connections current count, leaked connection count, connection delay time, etc.
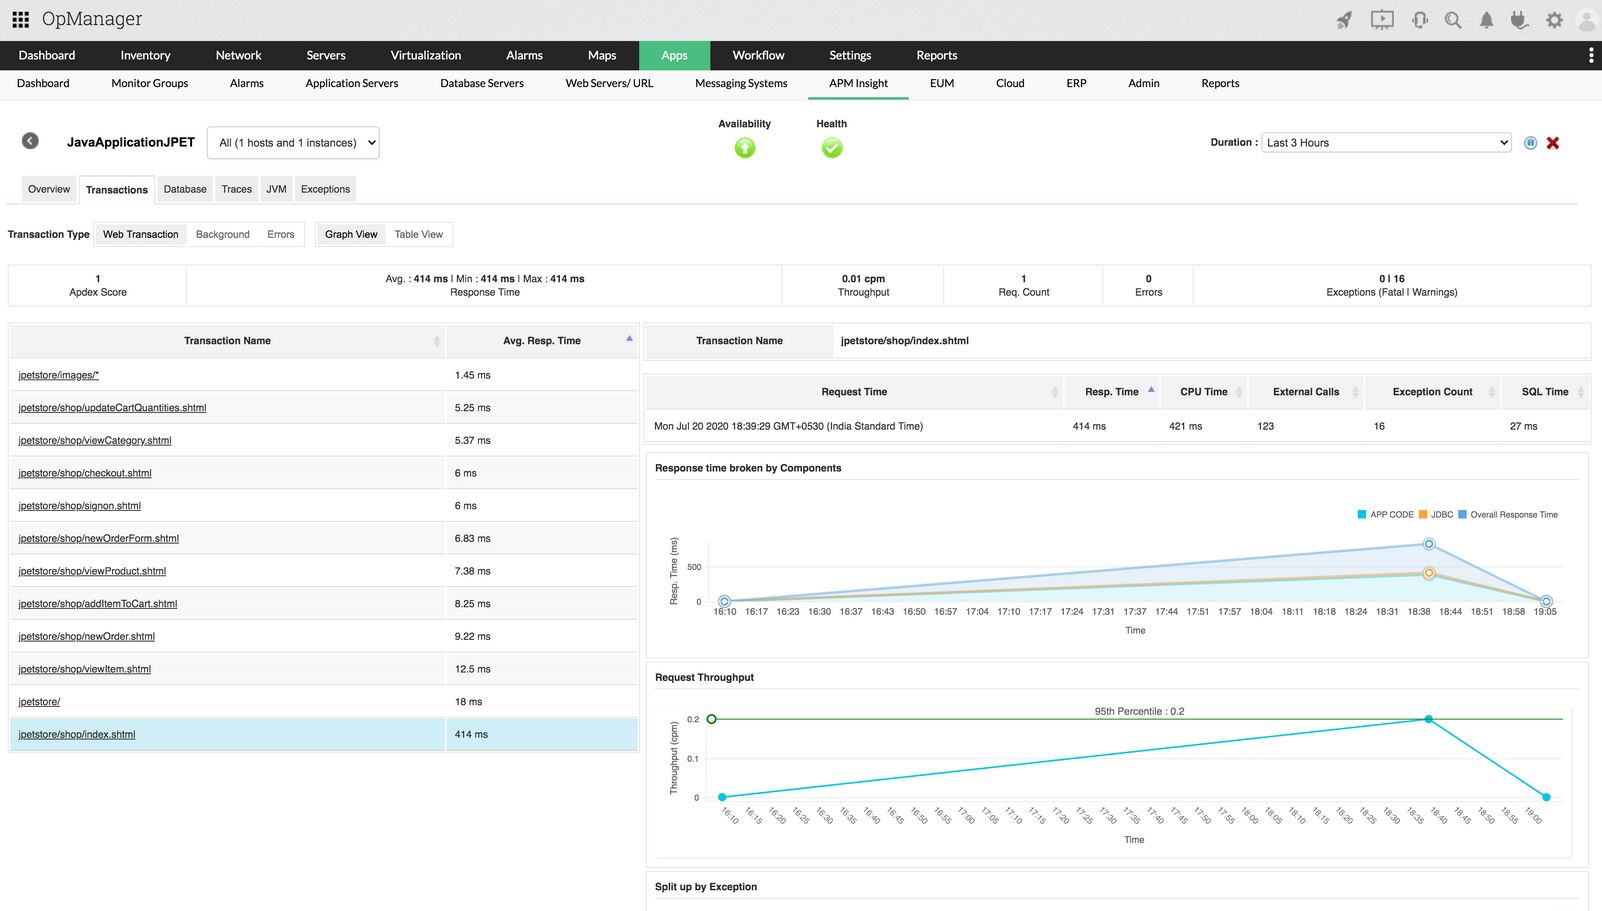
This photo was taken from the ManageEngine.com website.
Real-time Notifications & Intelligent Performance Alerting
IT alerting software delivers notifications for IT systems failures. These tools will monitor systems for poor performance, infrastructure issues, and other IT management issues. When a network monitoring solution discovers a performance issue, it will alert network administrators to the issue through a notification system — usually SMS or email.
Additionally, network monitoring tools examine and optimize performance while providing detailed performance data for reporting.
At result, a network alerting software:
- Monitors IT systems for abnormalities
- Automates alerts for incidents
- Delivers notifications to system administrators
Logging operation is useful when your network monitoring tool can leverage syslog and SNMP trap data to provide you with additional insights into performance and availability. Today, most NPMs have this ability. These NPMs include: SolarWinds NPM (Orion), ManageEngine OPmanager, PRTG, Datadog, and etc.
Reporting
The right NPM will allows you to generate reports including but not limited to:
- Wi-Fi Health
- Proactive Alerts
- Process logs
PRTG
In PRTG software, reports are also included in the free SNMP server monitoring software. Among other things, they feature clear and comprehensible charts. PRTG includes a reporting engine for on-demand report generation as well as scheduled report generation in HTML, PDF, comma-separated values (CSV), and Extensible Markup Language (XML) format.
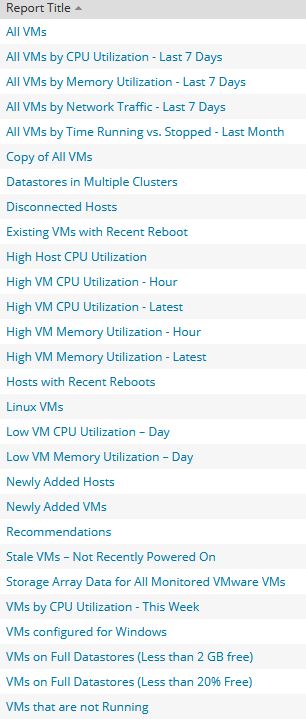
The default reports available in ManageEngine OpManager include:
- System
- Health and Performance
- Availability and Response
- Inventory
- WAN RTT Monitors
- VoIP Monitors
- Virtual Servers report
- Storage Reports
- Forecast reports
- WLC reports
- My Favorites
- Schedule Reports
- Integrated Reports
- Advanced Reports
SolarWinds Orion (NPM)
SolarWinds provides predefined reports for each Orion Platform product. Use the web-based interface to customize these predefined reports and create your own reports. In the following figure, you can see the panel related to the reports of this software:
This photo was taken from the SolarWinds Orion ( demo online)
Performance Management (Bandwidth & Troubleshooting)
What’s bandwidth? In computing, bandwidth is the maximum rate of data transfer across a given path. Network bandwidth is the capacity of a wired or wireless network communications link to transmit the maximum amount of data from one point to another over a computer network or internet connection in a given amount of time — usually, one second. Knowing how bandwidth is performing is crucial for administrators hoping to get a clear picture of their network’s performance.
Throughput and bandwidth can be used to measure an application’s speed but, of course, Bandwidth is not a measure of network speed, this is a common misconception. So, more bandwidth does not mean more speed.
Typically, bandwidth is expressed as a bitrate and measured in bits per second (bps). Modern network links have greater capacity, which is typically measured in millions of bits per second (megabits per second, or Mbps) or billions of bits per second (gigabits per second, or Gbps).
There are several other terms related to bandwidth, including:
- Throughput
- Delay
- Packet loss
- TTL
- Jitter
- Interference
We suggest you read this blog for more information on these terms: Measuring Network Performance Tools
Anyway, the right network management system will enforce bandwidth shaping policies that are based on user, device location, time and applications being used. The current devices, applications, and individual users within your network should be discovered using a continuously updated network monitoring tool. Using network monitoring software, you can detect devices and nodes operating.
NPMs should provide reports on your bandwidth usage across the entire network on a regular basis. Handling unplanned downtime can be challenging for any network administrator. Regardless of the severity of the problem the right NPM can save your organization from huge losses.
ManageEngine OpManager
ManageEngine OpManager’s network analysis tools include general bandwidth monitoring, which includes tracking bandwidth usage in real-time, including the ability to identify and keep track of top bandwidth; it also allows you to use flows to monitor routers and switches to balance your network bandwidth usage.
SolarWinds Orion
With SolarWinds Network Bandwidth Analyzer Pack (Network Performance Monitor + NetFlow Traffic Analyzer) you can collect traffic data from NetFlow, sFlow, J-Flow, IPFIX, and NetStream. BAP will then parse this data into an easy-to-read format and display it on a centralized web-based interface, making it easy to view and analyze. With BAP Bandwidth Analyzer Pack, users can make Quality of Service (QoS) changes to optimize bandwidth usage. BAP helps users identify which apps and endpoints are consuming the most network bandwidth by tracking traffic arriving at ports, source and destination IPs, and protocols. Now, if there’s a sudden change in application traffic or if a device stops sending flow data, network managers can receive alerts, so you can quickly remediate the issue.
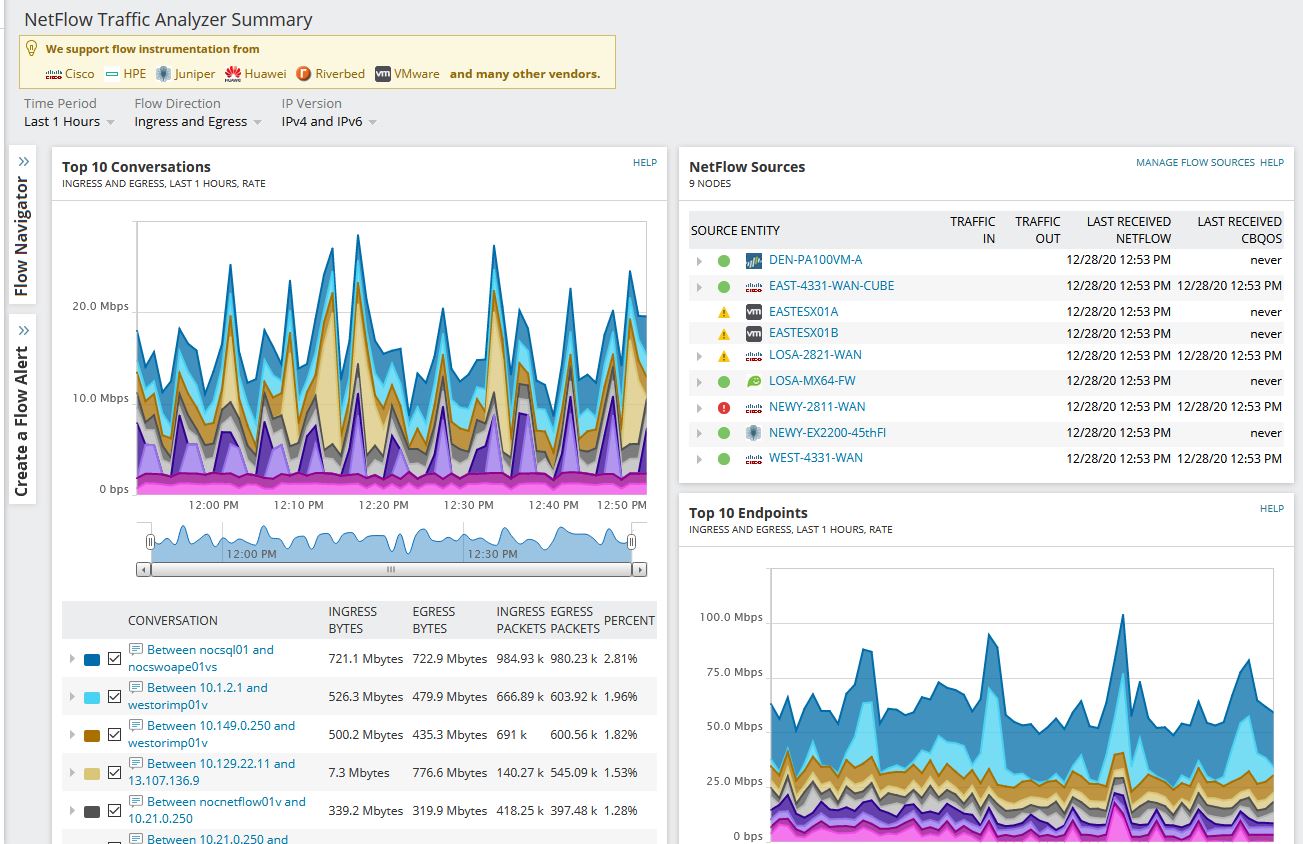
This photo was taken from the SolarWinds Orion ( demo online)
PRTG
PRTG has many sensor for bandwidth management:
- Packet Sniffer
- IPFIX
- Cisco ADSL
- NetFlow V9
- sFlow
- NetFlow V5
- NetApp Storage
- SNMP
- Cisco ASA VPN
- Windows Network Card
- jFlow
- IPFIX / xFlow /Packet Sniffer / SNMP
PRTG bandwidth monitoring tool will help you to monitor bandwidth, detect and measure heavy bandwidth overloads, quickly recognize potential disruptions – and get down to the root of the problem. PRTG shows net bandwidth consumption based on various parameters such as port numbers, IP addresses, protocols, etc., using either Packet Sniffing or xFlow sensors (NetFlow, sFlow, jFlow, and IPFIX).
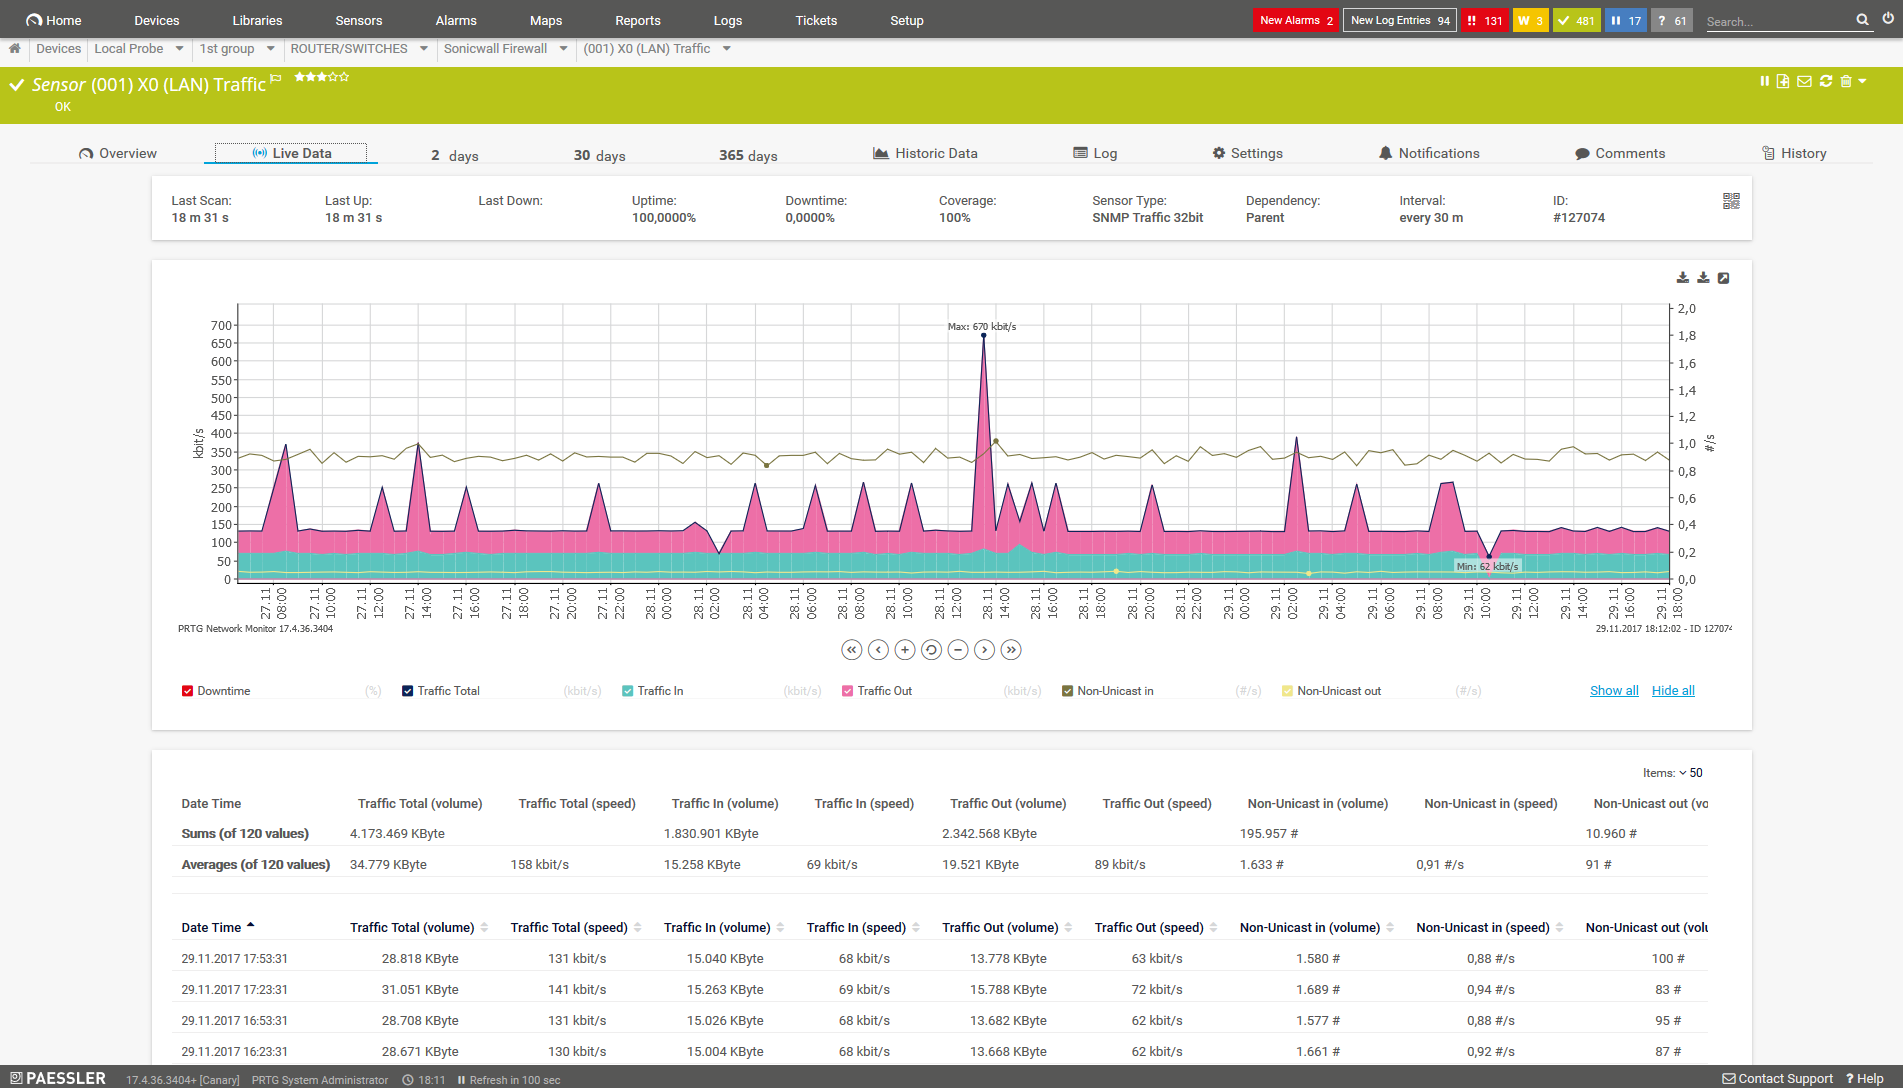
This photo was taken from the paessler.com website.
Custom alerts notify you about bandwidth shortages via SMS, email, or push notifications.
Datadog
And finally datadog. Datadog has bandwidth management capabilities. These capabilities include traffic control, bandwidth control, troubleshooting traffic detection, notifications and alerts on how to use bandwidth, and more.
——————————-
Sources: