In these four blogs, we are going to talk about the main features of a performance management tools and monitoring software and, as far as possible, compare some popular software in this area. In these four blogs, we are going to talk about the main features of a network management and monitoring software and, as far as possible, compare some popular software in this area.
List of other blogs in this blog collection about network monitoring tools:
Network Monitoring and Performance Management (NPM) Tools – Part 1
Network Monitoring and Performance Management (NPM) Tools – Part 2
Network Monitoring and Performance Management (NPM) Tools – Part 4
User Experience Monitoring
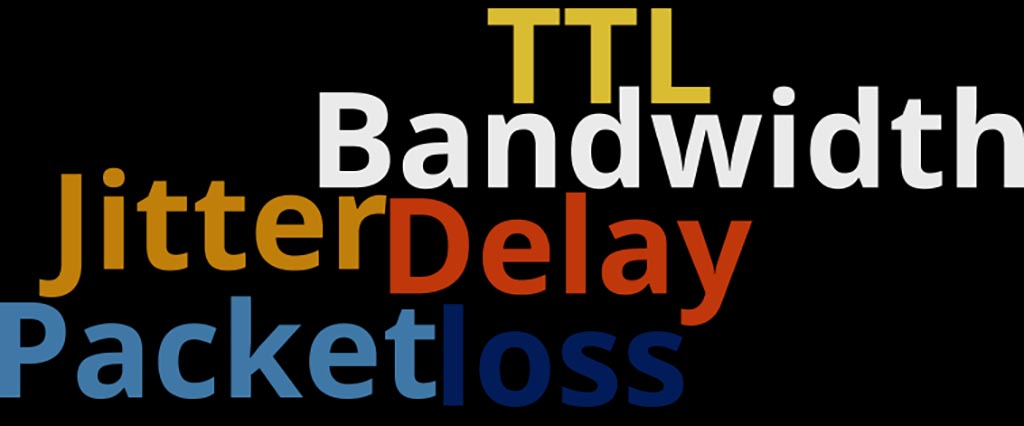
This is an approach to network monitoring that focuses on how your network is performing at endpoints. By tracking every transaction in the customer’s journey, IT professionals can optimize the user experience with end-to-end performance monitoring tools that quickly identify application issues.
There are four primary approaches to End User Experience Monitoring:
- Deployment models
- Data transmission and compliance
- Monitoring Mobile Apps
All four vendors we surveyed offered apps for mobile monitoring:
- SolarWinds: Mobile Applications for Android and iOS
- PRTG: Apps for Mobile Network Monitoring
- ManageEngine: Desktop Central for Mobile (Android and iOS)
- Datadog: Mobile app (Android and iOS)
To comply with the General Data Protection Regulation, companies need to take a plethora of security measures and monitor them constantly.
SolarWinds
SolarWinds Security Manager (SEM) helps make it easy to meet network security monitoring and log management requirements imposed by many auditing authorities.
Also, SolarWinds SEM collects and monitors activity logs from your users, network elements, databases, and applications to help you discover potential compliance violations. With SEM you can also respond to critical events by either sending notifications or using the active response functionality to trigger automated actions.
Finally, SolarWinds SEM provides IT operational and security audit information to meet industry-specific compliance requirements, like PCI DSS, GLBA, SOX, NERC CIP, HIPAA, as well as internal corporate compliance standards.
PRTG
Through its Uptime Alliance Program, Paessler AG works together with the manufacturer EgoSecure, whose eponymous software solution covers a comprehensive portfolio of functions that enable companies to set up their IT infrastructure in compliance with the data protection requirements. (Source: paessler.com)
ManageEngine OPmanager
In this regard, ManageEngine suggests a powerful product called DataSecurity Plus. With this product, you can generate customizable audit-ready reports for SOX, HIPAA, FISMA, GDPR, PCI, GLBA, and much more, and you ensure high levels of security.
Datadog
Datadog has released a new product is called Compliance Monitoring recently. It’s a new offering within the Datadog security platform that makes it easy to track the compliance posture of your production environment, and automate audit evidence collection. In fact, Compliance Monitoring enhances security visibility in two crucial ways:
- It continuously assessing the state of your cloud environment, such as security groups, storage buckets, load balancers, databases, and several other popular cloud services.
- This product enhances Datadog Agent to review local configuration information from servers, containers, and Kubernetes clusters.
All four vendors and platforms we study in this article provide services and models for cloud development.
- For SolarWinds Orion, read this article and this article
- For PRTG, read this article
- For Datadog, read this article, and this article
- For ManageEngine, read this article
Natural Scalability and The Ability to Grow with Your Needs
It’s a good bet that your network is constantly growing to accommodate more and more hardware and connections. So, your network monitoring solution needs to be able to scale up and down as your network grows. If your NPM constantly updates to reflect the current state of your network, it’s a safe bet it will handle scalability well. Ideally, your monitoring tool will be able to handle an unlimited number of devices; however, if it doesn’t, you should know beforehand how scalable your monitoring system is. Companies that run multiple networks must choose an NPM that can detect and fully monitor every network simultaneously.
SolarWinds Orion (NPM)
SolarWinds Orion Platform provides enterprise-class infrastructure management software designed to help manage and monitor data centers and IT infrastructure. Most deployments are based on a single Orion Platform server that monitors the infrastructure and applications. After a while, your business and the size of your organization may grow. So in this situation, you can deploy a scalability engine to reduce the load on the main polling engine. For example, if you have more than 20 users accessing the web console simultaneously, then SolarWinds recommends the installation of an additional web server that will load balance the number of concurrent users.
PRTG
Increased scaling and architectural flexibility, allowing you to deploy 20,000 or more sensors* across an unlimited number of PRTG servers. For smaller environments you can go for the most basic PRTG architecture: a PRTG core server with all of your sensors running on the same machine on the local probe.
But, there are two approaches that can be used to deploy PRTG in environments that require a multitude of sensors:
- Vertical scaling: This method is when you have a single PRTG server and add all additional sensors to this configuration. It is easy to do and the preferred solution if you do not reach the performance limits for a single installation.
- Horizontal scaling: This method is where you add multiple PRTG servers to the environment. This is the approach that works best for really large scale environments. There are several scenarios for scaling PRTG horizontally, for examples multi-server-silo-environment, and multiple independent configurations to balance the workload.
ManageEngine
ManageEngine OpManager Enterprise Edition is designed to scale the network monitoring and management needs of large enterprises. The Probe–Central architecture makes it possible for robust enterprise monitoring. It allows to scale as and when an enterprise grows and expands, without compromising on the reliability. It lets you distribute the polling engine by adding more probes for enterprise network monitoring. The ability to distribute the network discovery and monitoring load across multiple Probes, helps OpManager scale many interfaces. You can enable remote network monitoring by deploying the Probes in remote sites.
Switchport Management
The Switch Port Management (SPM) features allow at-a-glance management of all switched access interfaces in the network. Users often confront issues such as rogue/unknown devices on their switched networks, devices that frequently shift between switch segments, and a general lack of ability to track who connects when and where.
Additionally, video, voice and data can unite in one high-efficiency network when 8, 16 or 24-port switches are utilised. Port managed switches will deliver Fast Ethernet and Gigabit capabilities, as well as PoE functionality. Management of VLAN, QoS, link aggregation, and other features may also be available depending upon the managed switch model. A network administrator must be able to monitor and manage all of these switch ports and the traffic to each of them.
ManageEngine
ManageEngine OpManager scans your switches and maps all physical ports and their attached devices, all the way to their physical locations.
PRTG
PRTG can monitor switch ports with its own sensors. Sensors such as SNMP sensor, packert Sniffer sensor, and jFlow sensor.
SolarWinds Orion (NPM)
SolarWinds has introduced a product called “User Device Tracker” to monitor switch port management. With this product, switch port monitoring can be enabled for all switches where administrators need insight into port utilization, CPU load, memory and detailed port data along with active and historical port utilization details. Device information like port details are stored in a database called Management Information Base (MIB).
Datadog
Datadog has not yet offered a product and a significant possibility in the discussion of monitoring the management of hardware switch ports.
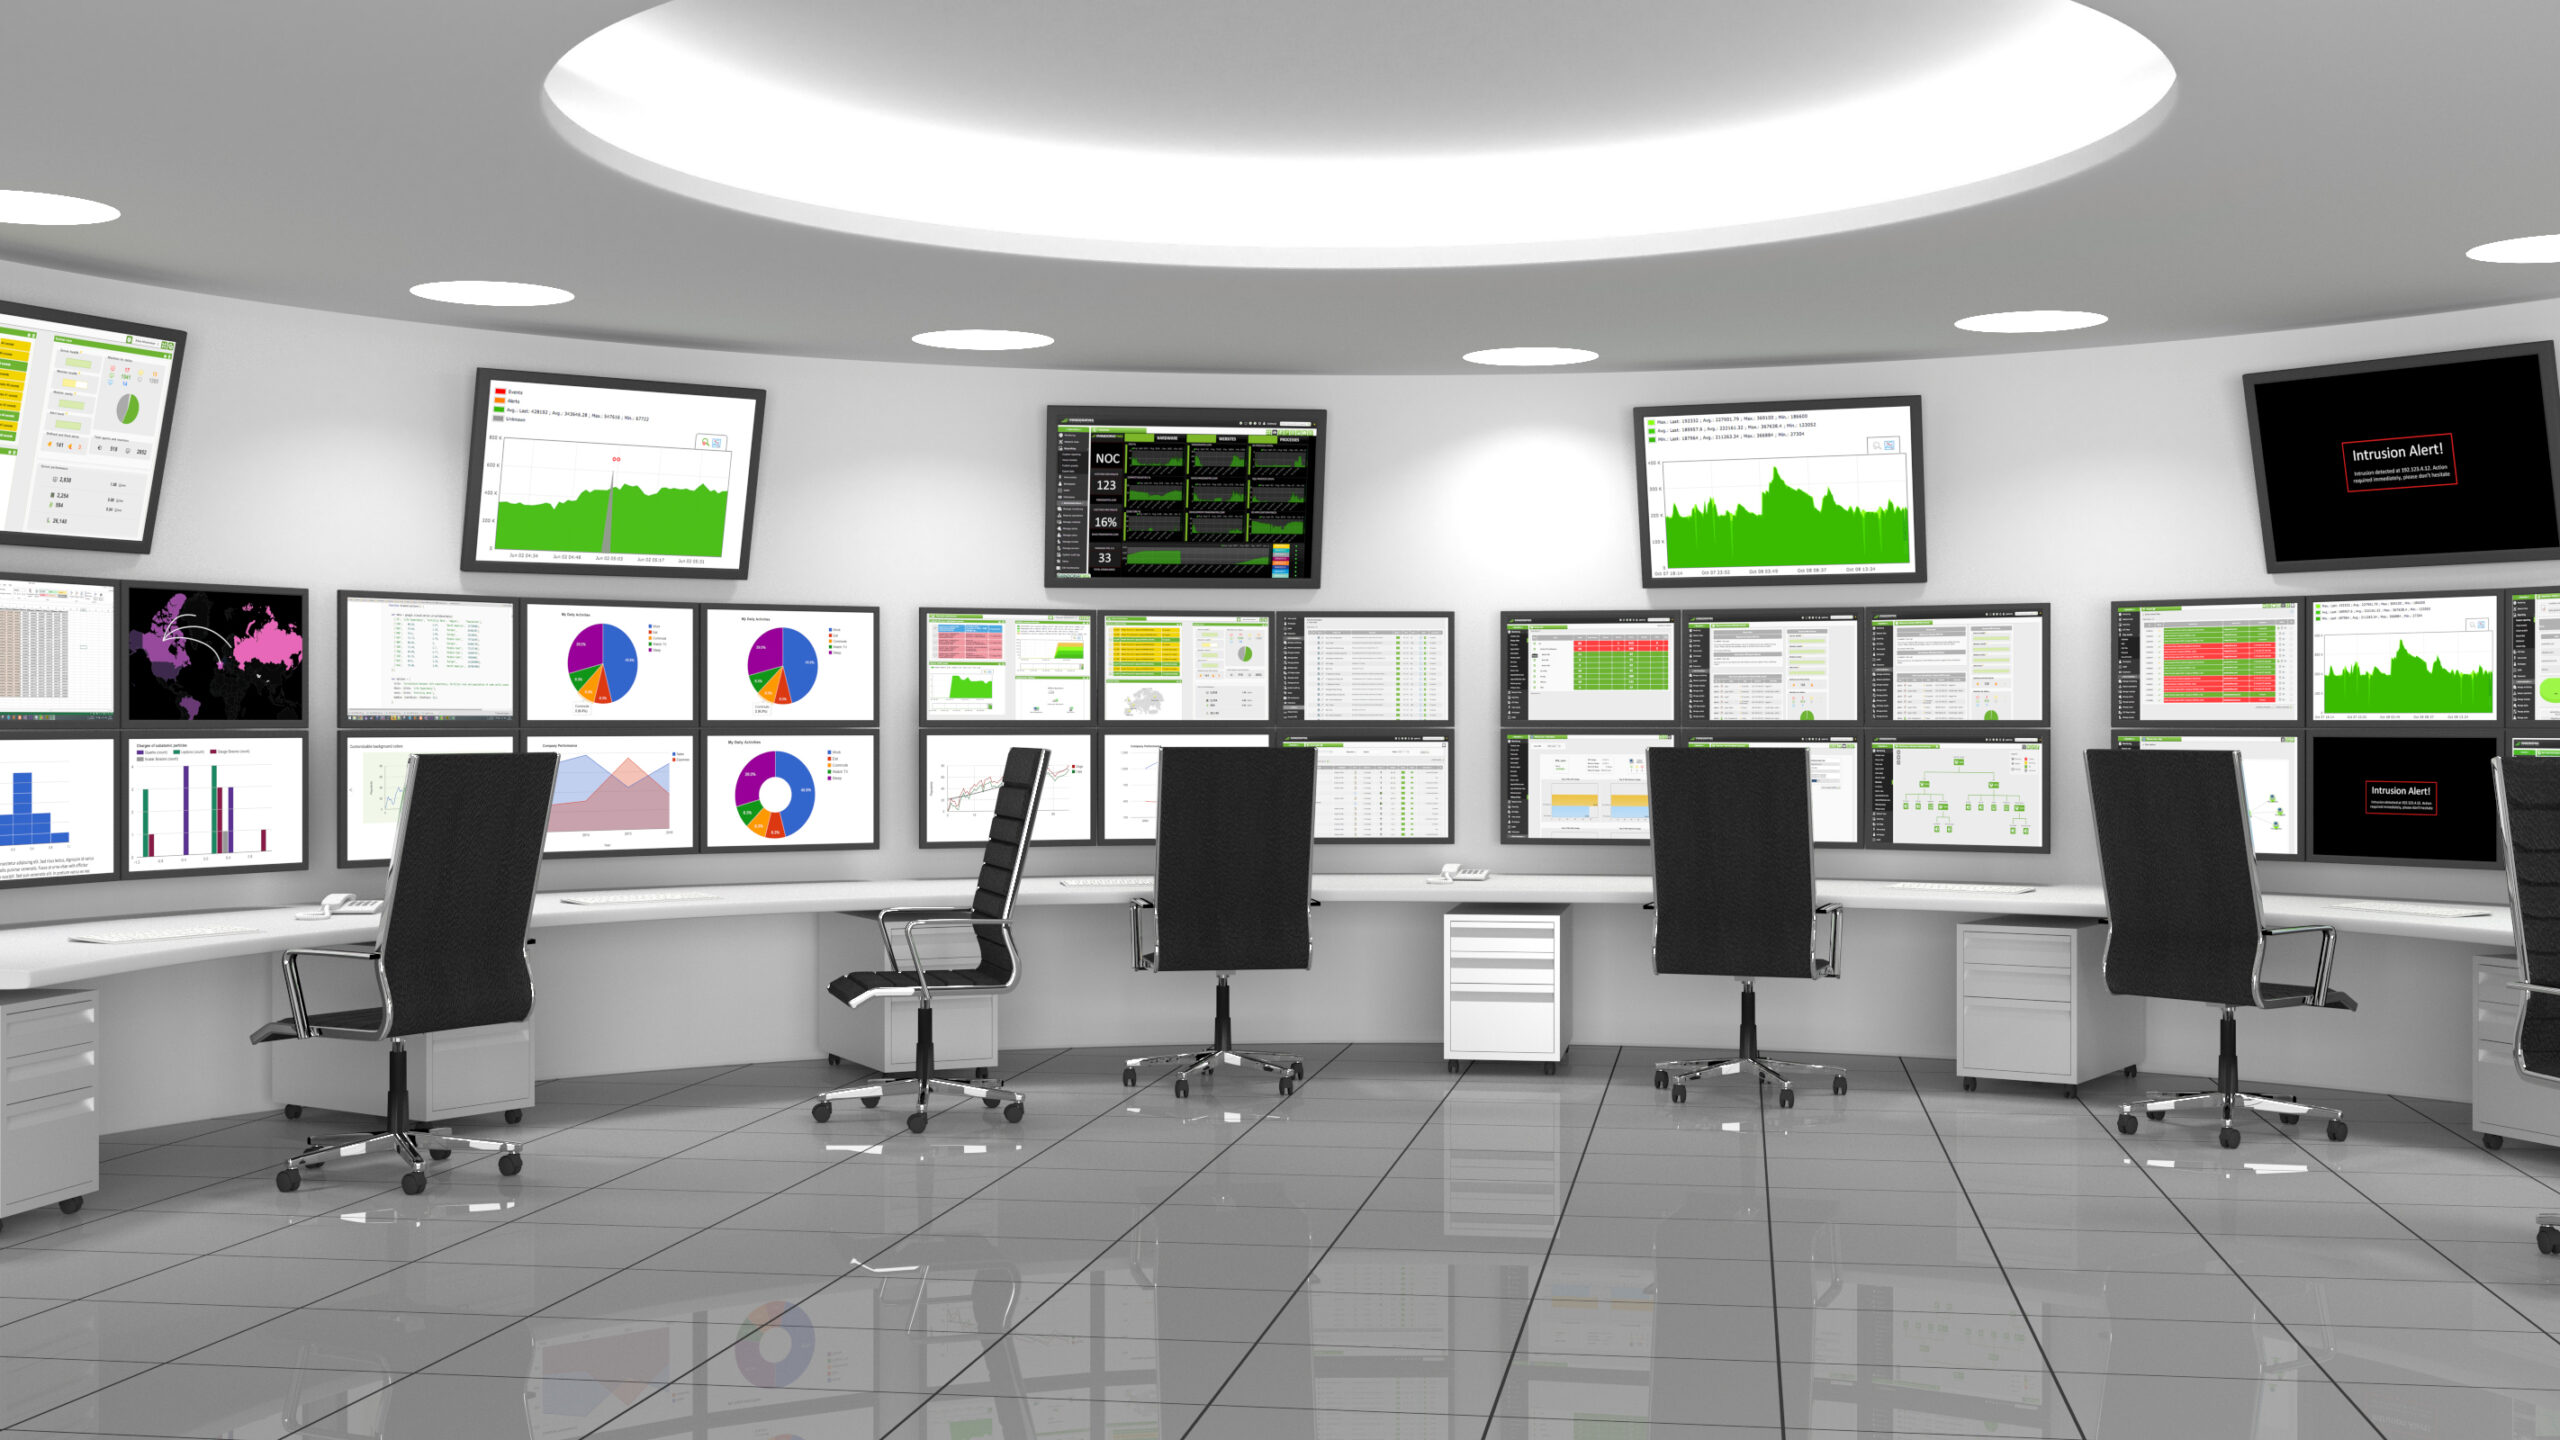
Dashboard Customization
This ability is very important. The dashboard is the interface your team uses to interact with a network monitoring program. Intuitive dashboards and detailed reports helps you determine the performance of your network in very less time.
A dashboard is Datadog’s tool for visually tracking, analyzing, and displaying key performance metrics, which enable you to monitor the health of your infrastructure. All dashboards listed are sortable using the column headers Star, Name, Modified, and Popularity.
Similarly, the other products we’ve been studying on these blogs, PRTG, ManageEngine OPmanager, and SolarWinds Orion, have so much flexibility in customizing the dashboard that they need no description.
——————————-
Sources: