Every network performance monitoring (NPM) solution allows companies to discover performance issues on a network as they occur. The more advanced network monitoring tools will be pumped with features that make performance tracking easier or more comprehensive. In these four blogs, we are going to talk about the main features of a network management and monitoring software and, as far as possible, compare some popular software in this area. In these four blogs, we are going to talk about the main features of a network management and monitoring software and, as far as possible, compare some popular software in this area.
We recommend that you read the following blog before reading this series of blogs:
In these blogs, we review the following four software or software packages. Of course, we have published blogs about each of these softwares or software packages on this site (Except for ManageEngine OPmanager, of course). Just click on the name of each of them to be redirected to the blog related to that software:
- SolarWinds NPM
- PRTG Network Monitor (PRTG Paessler Router Traffic Grapher)
- Datadog
- ManageEngine OPmanager
Of course, in the case of SolarWinds, it should be noted that we have written a blog about SolarWinds NPM, but in this blog series we are talking about SolarWinds Orion. You need to know that SolarWinds NPM is part of SolarWinds Orion, and in fact, SolarWinds Orion is a much more complete software package about managing and monitoring almost everything on a small or large computer network.
List of other blogs in this blog collection about network monitoring tools:
Network Monitoring and Performance Management (NPM) Tools – Part 2
Network Monitoring and Performance Management (NPM) Tools – Part 3
Network Monitoring and Performance Management (NPM) Tools – Part 4
Features of an Ideal Network Management Software
We believe that an ideal network management and monitoring software should have the following capabilities:
- Real-time network performance updates and visualizations
- Automatic network device discovery and mapping
- SNMP compatibility
- Real-time notifications & intelligent performance alerting
- Reporting
- Performance management (Bandwidth & Troubleshooting)
- Performance issue diagnostics and root cause analysis
- User experience monitoring
- Natural scalability and the ability to grow with your needs
- Switchport management
- Dashboard customization
- VoIP management & monitoring
- IPAM management
- Real-Time visibility and analytics
- Universal compatibility
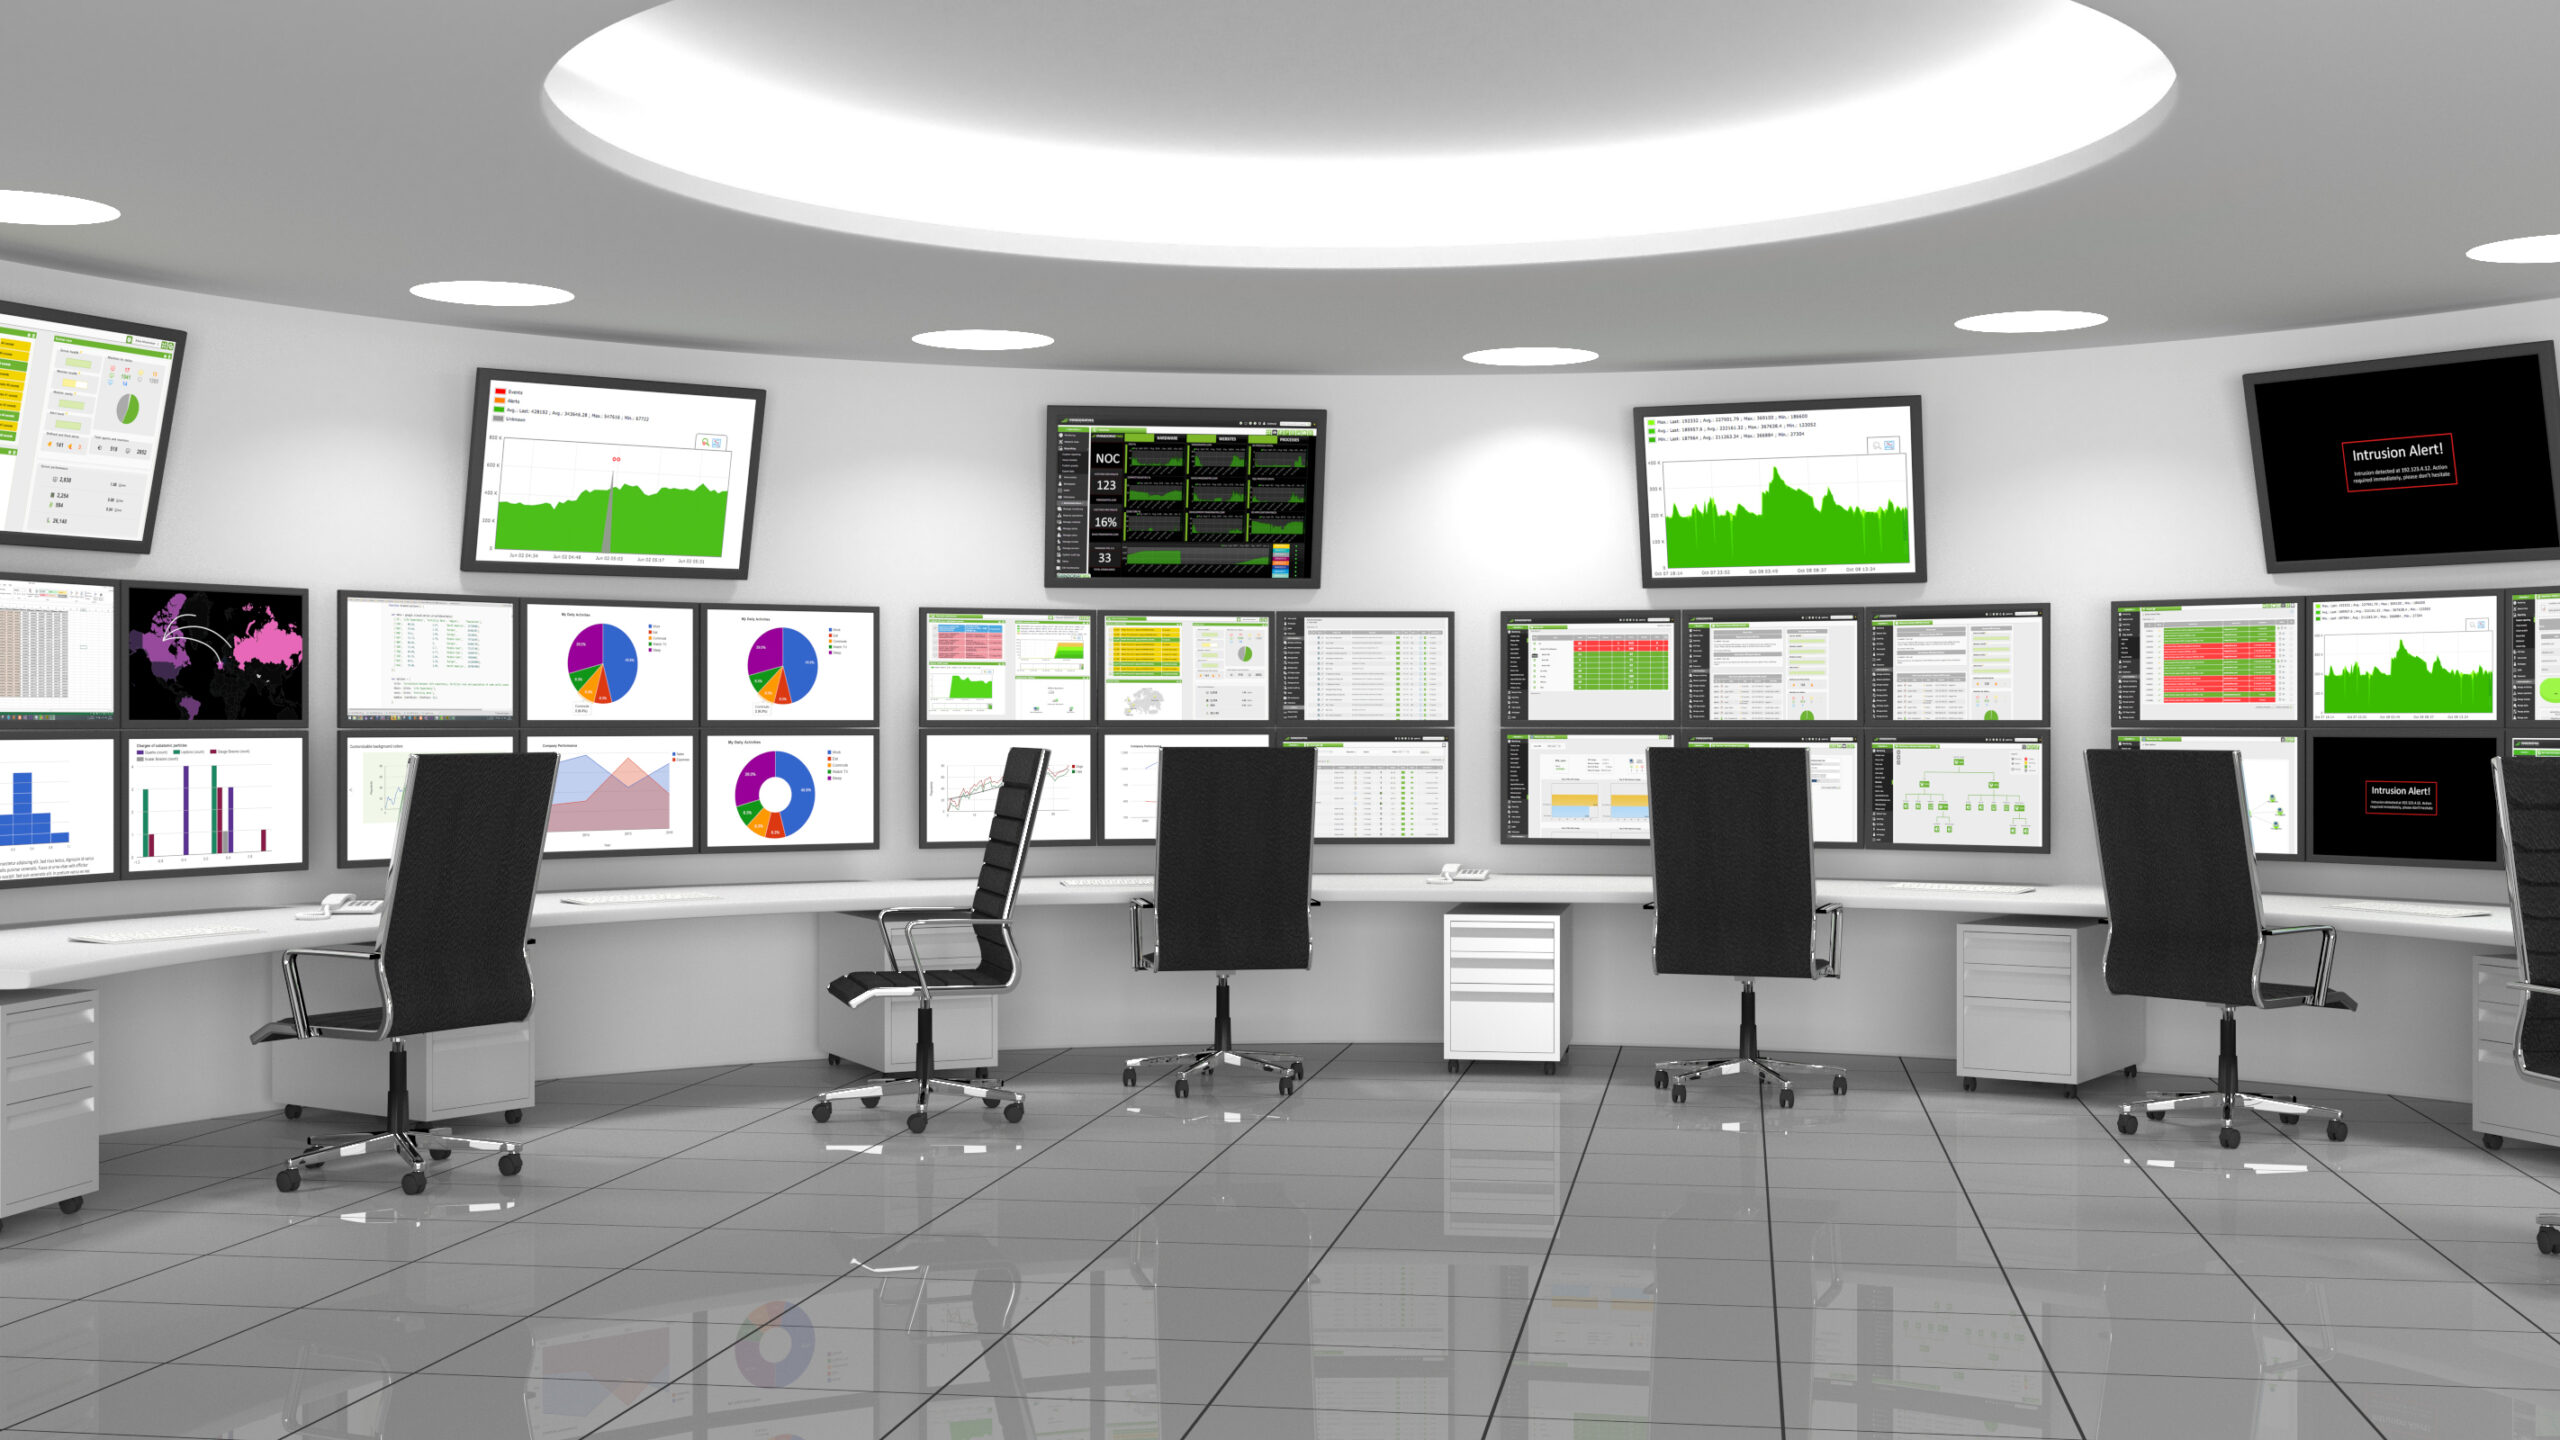
Real-Time Network Performance Updates and Visualizations
A network monitoring solution will compile information on network performance metrics and display them visually for the user. At result, your enterprise is able to more accurately keep track of performance levels and discover problems. With these network map visualizations, network managers can see the physical and logical relationships between routers, switches, servers, interfaces, volumes, and groups to quickly isolate and identify critical health and performance issues.
A good NPM can automatically updates network maps in real-time (or at least on a scheduled basis). That way, you’re not forced to manually update the map every time you bring a new device onto the network.
SolarWinds Orion (NPM)
SolarWinds® network visualization tools provide a unified view of network connections, applications, dependency relationships, topology, and ADM information. SolarWinds network visibility solutions are updated automatically without user intervention. Also, you can build maps from scratch or import auto-generated maps, customize layouts, and add them to any view or dashboard using the Orion Maps widget. Network Performance Monitor is a part of the SolarWinds Orion Platform.
ManageEngin OPmanager
ManageEngin OPmanager is a NPM that released by ManageEngin. With OpManager’s real-time graphs, administrators get:
- Real-time statistics on device CPU and Memory Utilization.
- Up-to-the-second information on any performance metric of a device.
- Real-time traffic/ Bandwidth utilization of an interface/ port.
Datadog
There is another good NPM in this field. Datadog’s Network Map, you gain a bird’s-eye view of your network to help you visualize network partitions, dependencies, and bottlenecks across all your infrastructure or services.
PRTG
The PRTG Real-Time Monitoring Tool uses all the best-known monitoring protocols to offer you data in real time. With PRTG you can visualize your network using real-time maps with live status information. In the event of changes and updates to network topology or network equipment, PRTG can receive and apply these updates quickly and automatically.
Automatic Network Device Discovery and Mapping
In order for your network monitoring solution to work properly, it needs to be able to discover new devices automatically. Most network monitoring solutions will draw network maps that display every piece of hardware connected to a network. These maps should automatically update to include new devices.
The first aspect of network discovery is finding all the IP addresses on the network, including static, dynamic, reserved, and abandoned IP addresses capable of being reallocated. Using network discovery to map the ports on your network can help ensure unnecessary ports are kept closed to prevent access by an intruder. The next step, figuring out how all the devices on the network are connected, and in which topology.
SolarWinds Orion (NPM)
SolarWinds NPM automatically scans your network, and it can show you your entire network topology with a visual mapping tool. Its NetPath function allows you to see pathways from your own network to destination services. Additionally, SolarWinds NPM includes performance monitoring functions to help you put this network information to good use. The SNMP polling features in SolarWinds NPM can also be used as an SNMP scanner on your network. This is beneficial in large and dynamic networks where device hardware may come from multiple vendors and otherwise have unique proprietary protocols.
PRTG
PRTG Network Monitor from Paessler providing monitoring over the whole network and it tracks network traffic, cloud service performance, and database capacity, as well as network uptime and application performance. Auto Discovery: The PRTG Auto Discovery facilitates your search. With this feature, all of the available devices in your network which are switched on for SNMP monitoring are checked, and suitable sensors are created, automatically.
Advanced IP Scanner is very good tool for network discovery. It’s free. It scans and identifies the Windows PCs on your network and can shut down and wake networked computers remotely. The main downside is its limited functionality.
Datadog
Datadog NPM has a powerful feature for network discovery. This feature is Autodiscovery that identify the services running on a specific container and gather data from those services. After configuring Datadog’s SNMP integration check with a provided subnet (or set of subnets), the Datadog Agent will scan that subnet and discover all SNMP-enabled network devices.
ManageEngine OPmanager
ManageEngine OpManager’s network device discovery tool has a few features for network discovery process. These features include:
- Network Discovery: Simplify the process of device discovery and extend it to a wide range of network devices with the help of Network Discovery.
- Discovery Schedule: Automate network discovery by scheduling it. Avoid repetitive, manual efforts and add or remove devices on a regular cycle.
- Discovery Reports: Gain powerful insights about your network in the form of detailed reports emailed right to you. Schedule these reports to be generated after almost any discovery function performed in OpManager.
- Device Templates: Classify your device models automatically and precisely using a set of preconfigured templates. These device templates have predefined monitors and variable threshold settings to generate alerts when SLAs are violated.
- Discovery Rule Engine: Accelerate the discovery process and automate all the post-discovery actions that require manual intervention, such as associating service monitors or plotting the device on maps. This makes network discovery and monitoring more efficient. (Source: manageengine.com)
SNMP Compatibility
A good NPM should support SNMP. This protocol allows your monitoring tool to communicate with devices in a shared language to streamline device monitoring.
PRTG
There is a perfect compatibility between PRTG and SNMP, and PRTG can use almost all of SNMP’s protocol capabilities. This is very good news.
- PRTG comes with several preconfigured SNMP sensors. Among these is a series of sensors developed especially for device manufacturers such as Cisco, HP, Dell, and Synology. The SNMP Custom Sensor also lets you monitor a number of other devices from a variety of different manufacturers via SNMP.
- Also, SNMP server monitoring software is equipped with a built-in alarm feature. You’re free to set the threshold values and alert method (email, SMS, or a free push notification to your smartphone) any way you please.
This photo was taken from the paessler.com website.
The Top-5 PRTG sensors for SNMP monitoring are:
- SNMP CPU Load Sensor
- SNMP Disk Free Sensor
- SNMP Memory Sensor
- SNMP Traffic Sensor
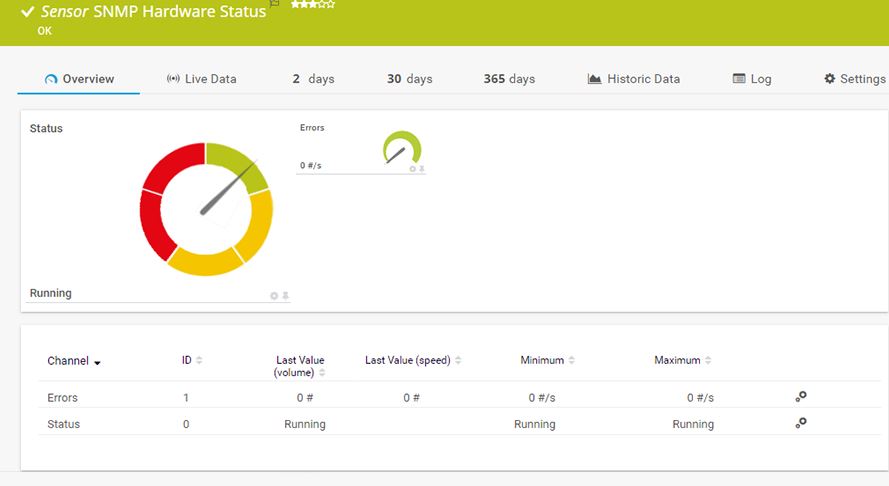
- SNMP Hardware Status Sensor
SolarWinds Orion (NPM)
The SolarWinds Orion platform, of which NPM (Network Performance Monitor) is a part, has a very comprehensive Compatibility with SNMP Protocol, and With NPM’s robust toolkit, admins on the Orion Platform can obtain a more in-depth look into network devices.
- SolarWinds NPM uses SNMP monitoring to poll the management information bases (MIBs) on your devices to obtain critical performance metrics.
- SolarWinds NPM is designed to simplify the detection, diagnosis, and resolution of network issues before outages occur by using an enhanced display of all network device information in fully customizable dashboards and charts.
- The SNMP polling features in SolarWindsNPM can also be used as an SNMP scanner on your network. With the insights gained from these SNMP performance statistics, admins can better optimize and troubleshoot network device performance.
- SolarWinds NPM also provides out-of-the-box network alerts, reports, and interactive charts so users can easily understand their network health and isolate performance bottlenecks.
ManageEngine OPmanager
ManageEngine OpManager is very adept at using SNMP’s capabilities. Here I would like to talk more about the ability of this software to interact with SNMP traps. ManageEngine OpManager provides a robust rule-based trap processing engine that supports handling around 300 SNMP traps per second. Not only does it handle monitoring of network devices, but it also collects Windows event logs from servers and workstations on your network, along with rule-based syslog collection and monitoring and the ability to set alerts for certain syslog events.
ManageEngine OPmanager monitor Tx/Rx traffic, errors, discards and utilization via SNMP.
Datadog
We can use Datadog to visualize, correlate, and alert on metrics from your SNMP-managed devices for greater visibility into your network’s health and performance. With Datadog’s SNMP integration, you can easily monitor and alert on the health and performance of your on-premise network infrastructure alongside the rest of your stack from one centralized platform. The Datadog Agent collects SNMP data from network devices by polling OIDs, and submitting the responses as metrics. These metrics are then available for visualization, correlation, and alerting across the Datadog platform so you can easily trace the root cause of the issue.
After configuring Datadog’s SNMP integration check with a provided subnet (or set of subnets), the Datadog Agent will scan that subnet and discover all SNMP-enabled network devices.
——————————-
Sources: